Have you ever thought about what educational resources you had available to you as a child? Aside from school, what else was there in your neighborhood that afforded you the ability to acquire knowledge? Maybe someone in a rural or rural-suburban area may have had plenty of time to run around outside and learn about the natural environment through self-directed investigations. Someone in an inner-ring suburb – densely populated housing developments just outside a city – whose parents owned a car may have had access to both city and suburban cultural opportunities. Someone living downtown may have had access more world-class learning opportunities like museums and playhouses.
Now, think about kids who live deep within the city whose parents have no vehicle and who are too young to take public transportation. What learning resources do they have available to them?
To highlight this idea, I invented a concept called Learning Triangles. This idea takes our Maker Jawn participants’ home locations, school locations, and the library they participate in our program at to visualize the area where they complete their daily learning activities. Is it not true that during the school year a child spends most of his time at home and at school? We can assume they spend a lot of time at their libraries, too because they are frequent participants in our program. By looking at a few participants’ Learning Triangles an analysis of what resources are available to them on any given day can begin to take shape.
This concept requires further research, but I think it’s an important topic that helps us visualize just how important the Maker Jawn program and the Free Library of Philadelphia are to the communities they serve.
First, a sample of what a learning triangle might look like so the concept can be easily understood. In this example, a fictional student goes to the Science Leadership Academy (SLA), lives in Brewerytown and visits the Cecil B. Moore branch of the Free Library to do their homework. Each point on any given triangle represents a home, a school, or a library.
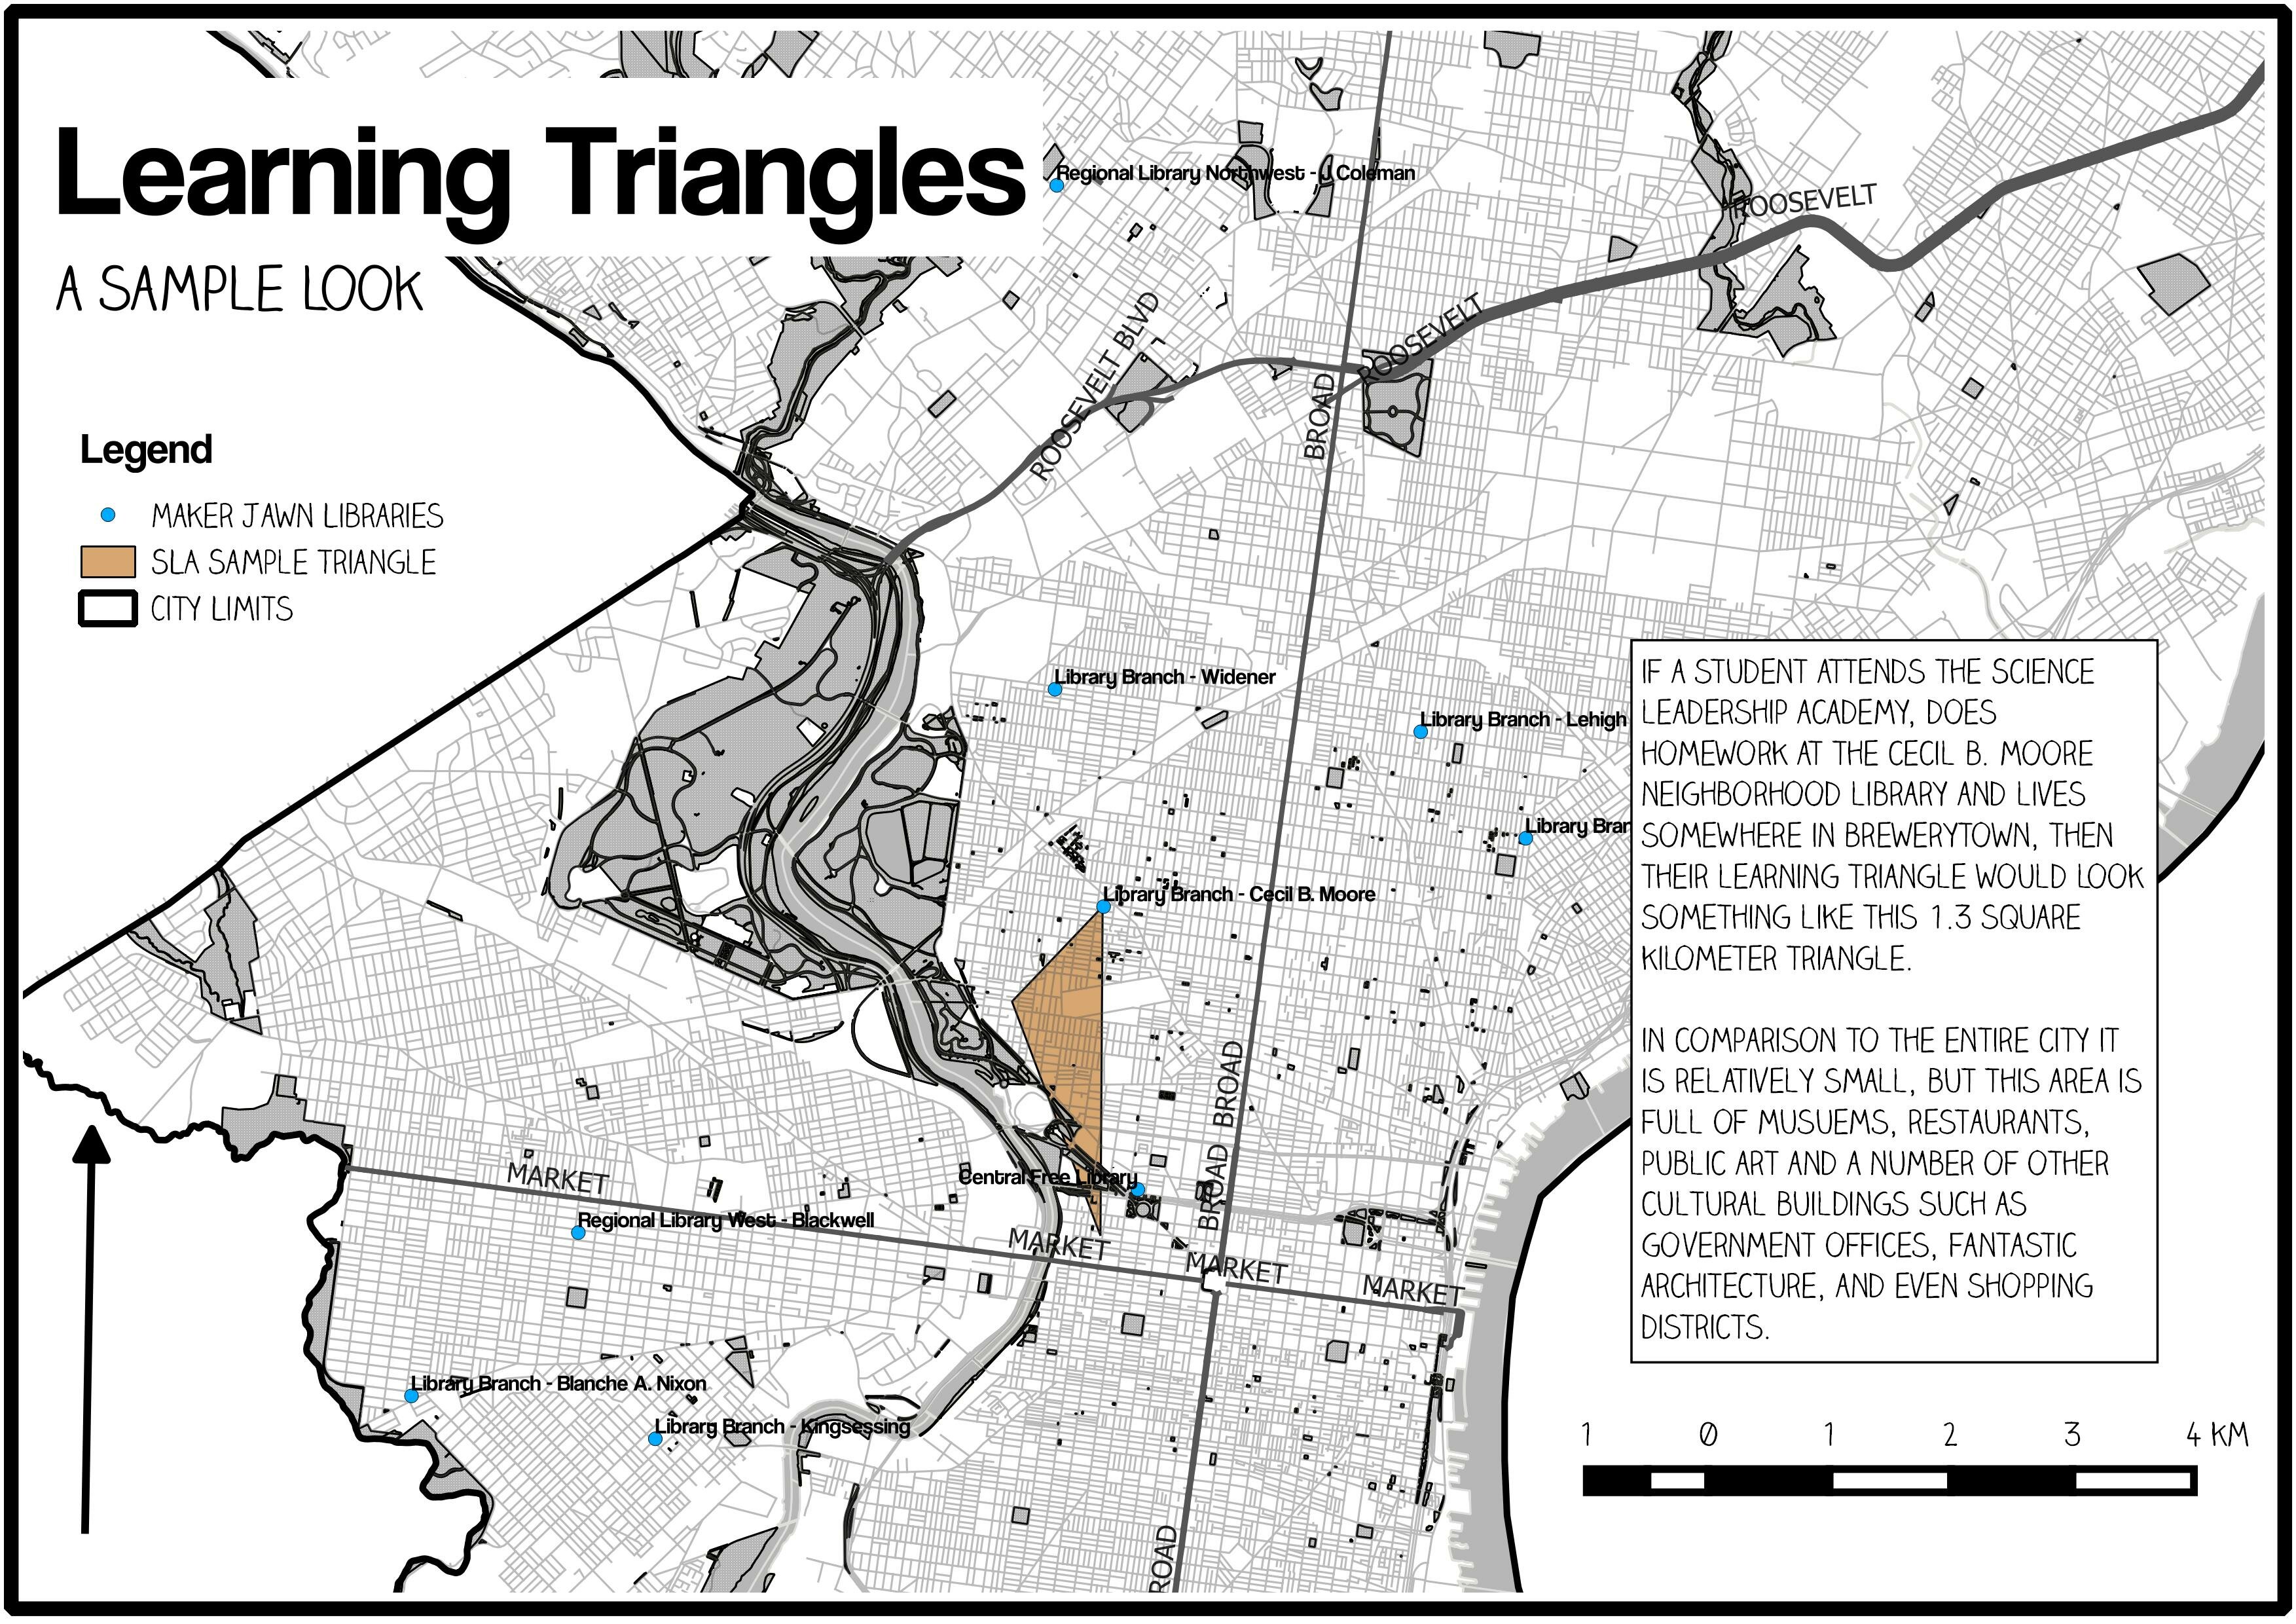
Notice how much area is encompassed by this example. It stretches a good 20 square blocks and passes nearby museums, libraries, restaurants and public art.
Now, take a look at map at the following maps, all of which use data from our participants. Remember, each point on the triangle either a home, school, or library.

The above map shows a few of our Paschalville participants’ learning triangles. They are generally small, and the biggest triangle on this map actually passes through a three-square block empty lot – hardly inspiring. There is community here, but other amenities are lacking.
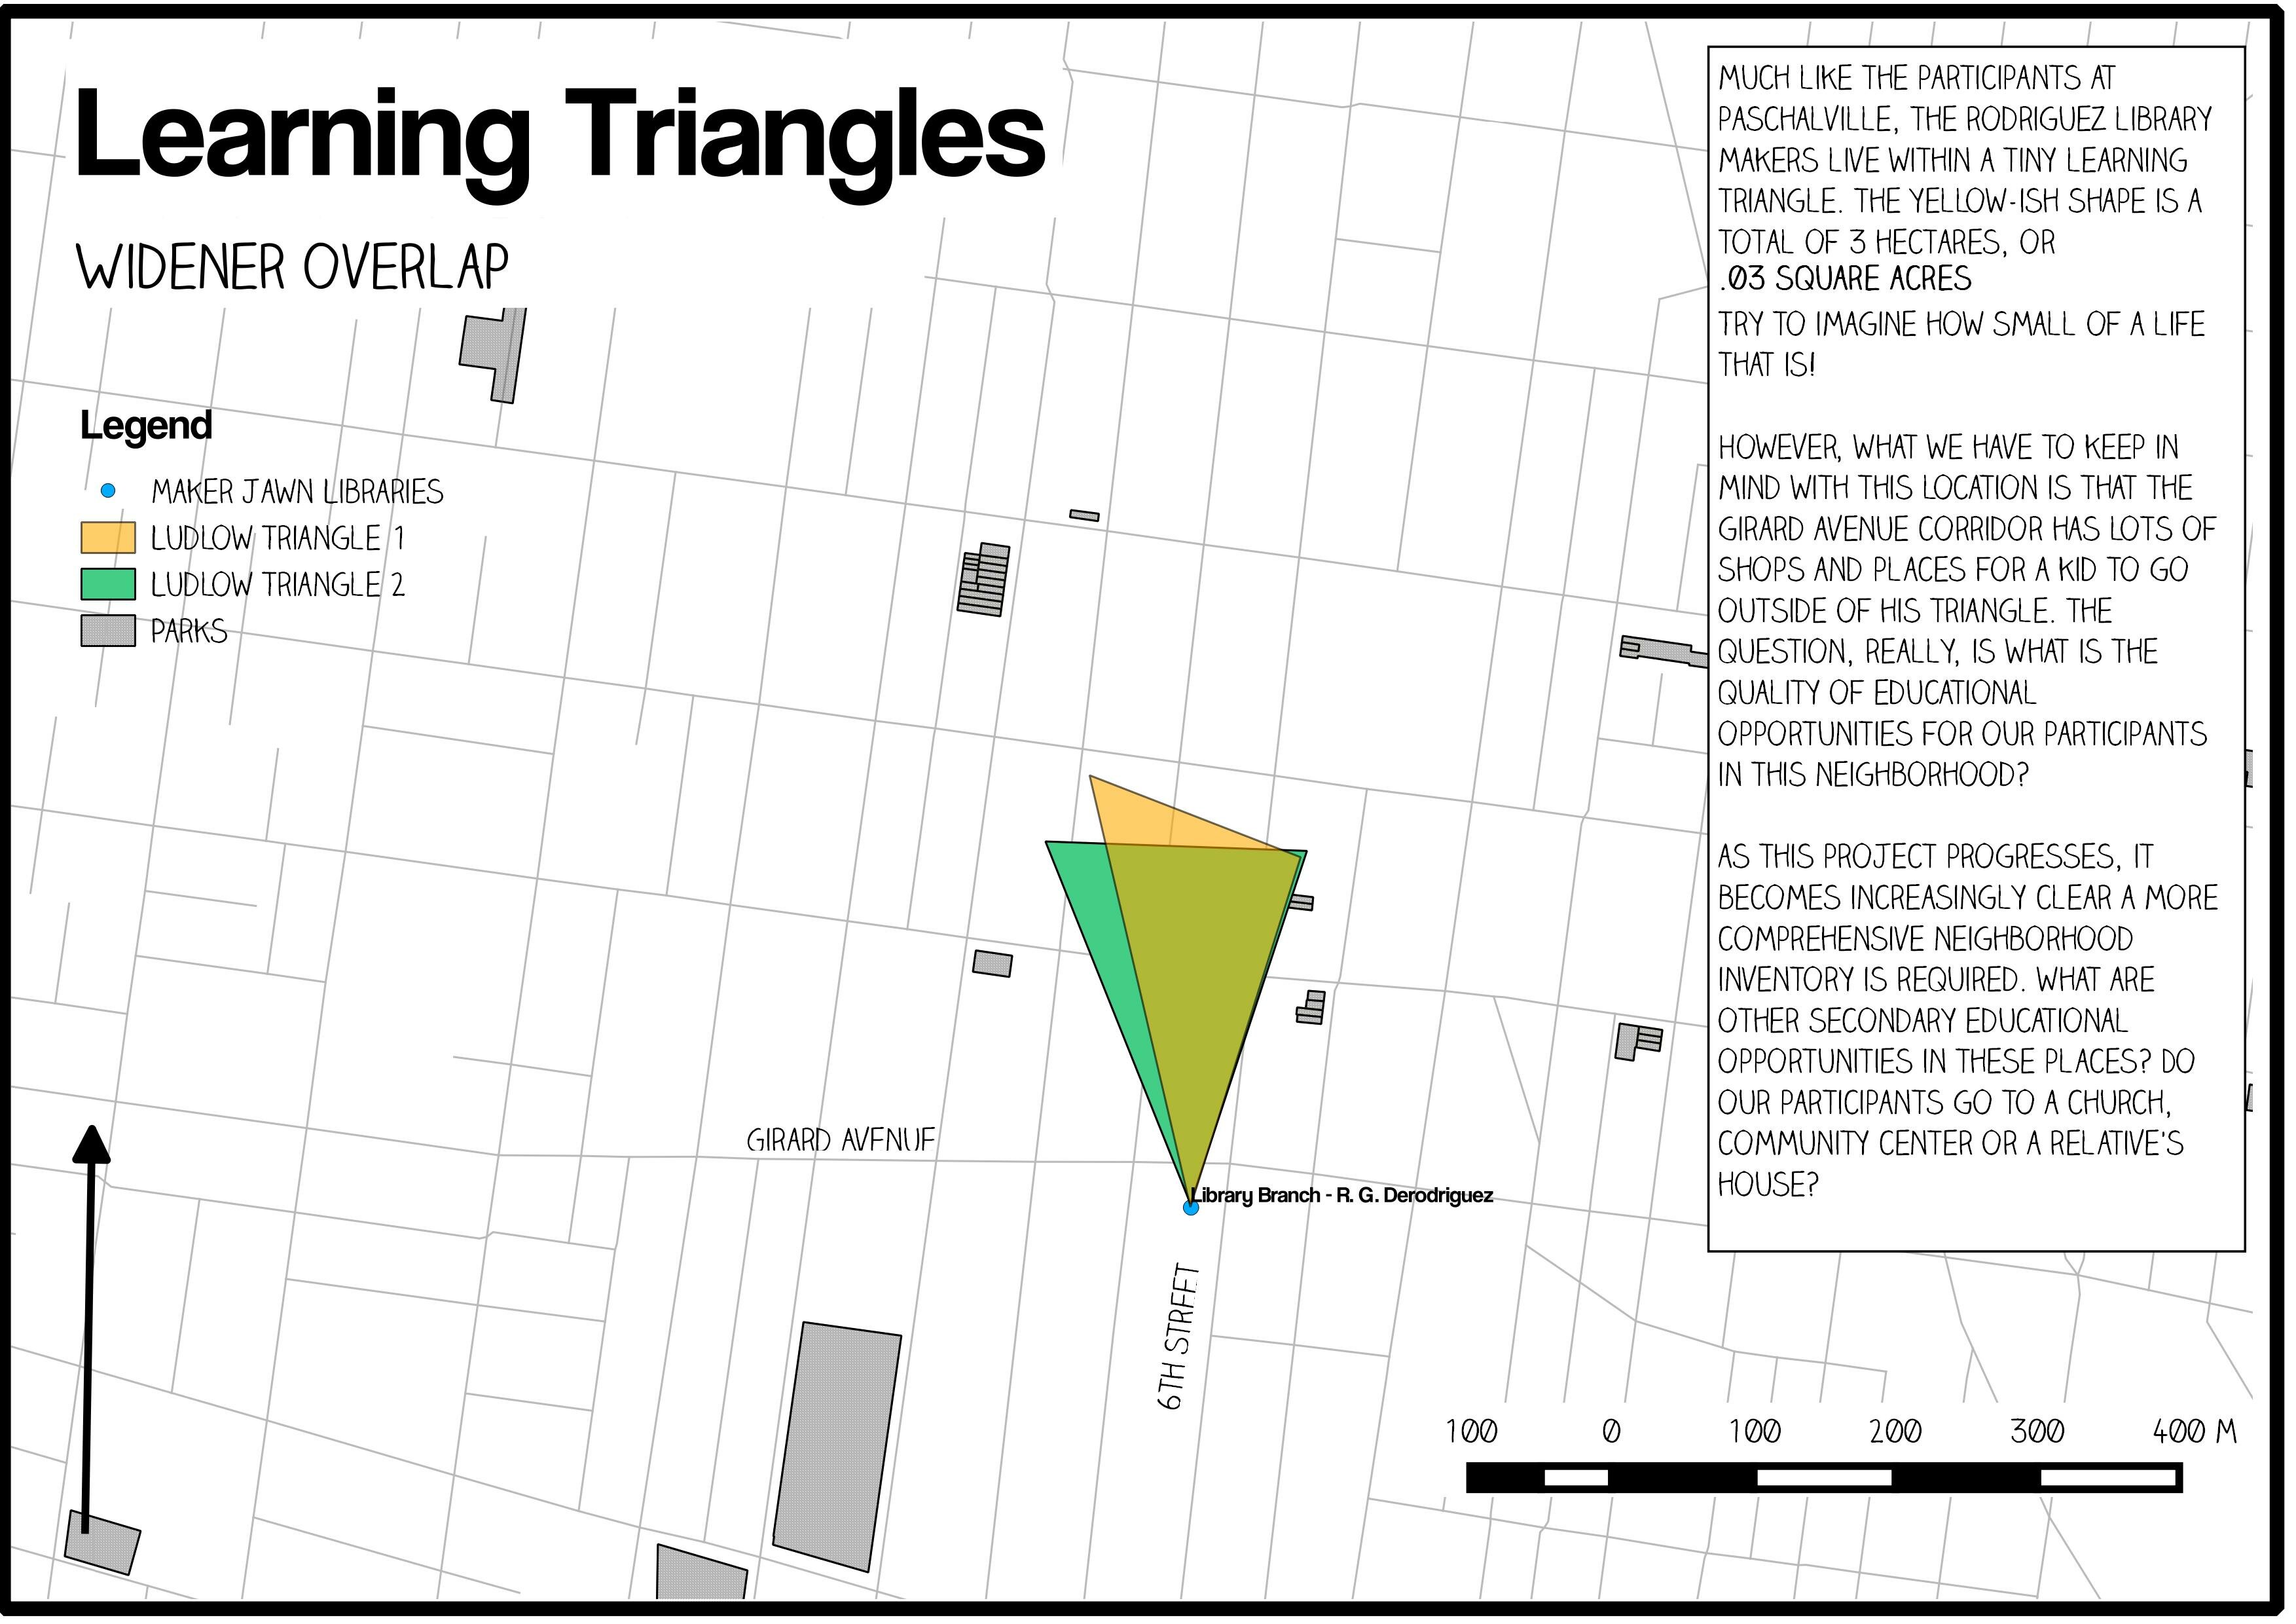
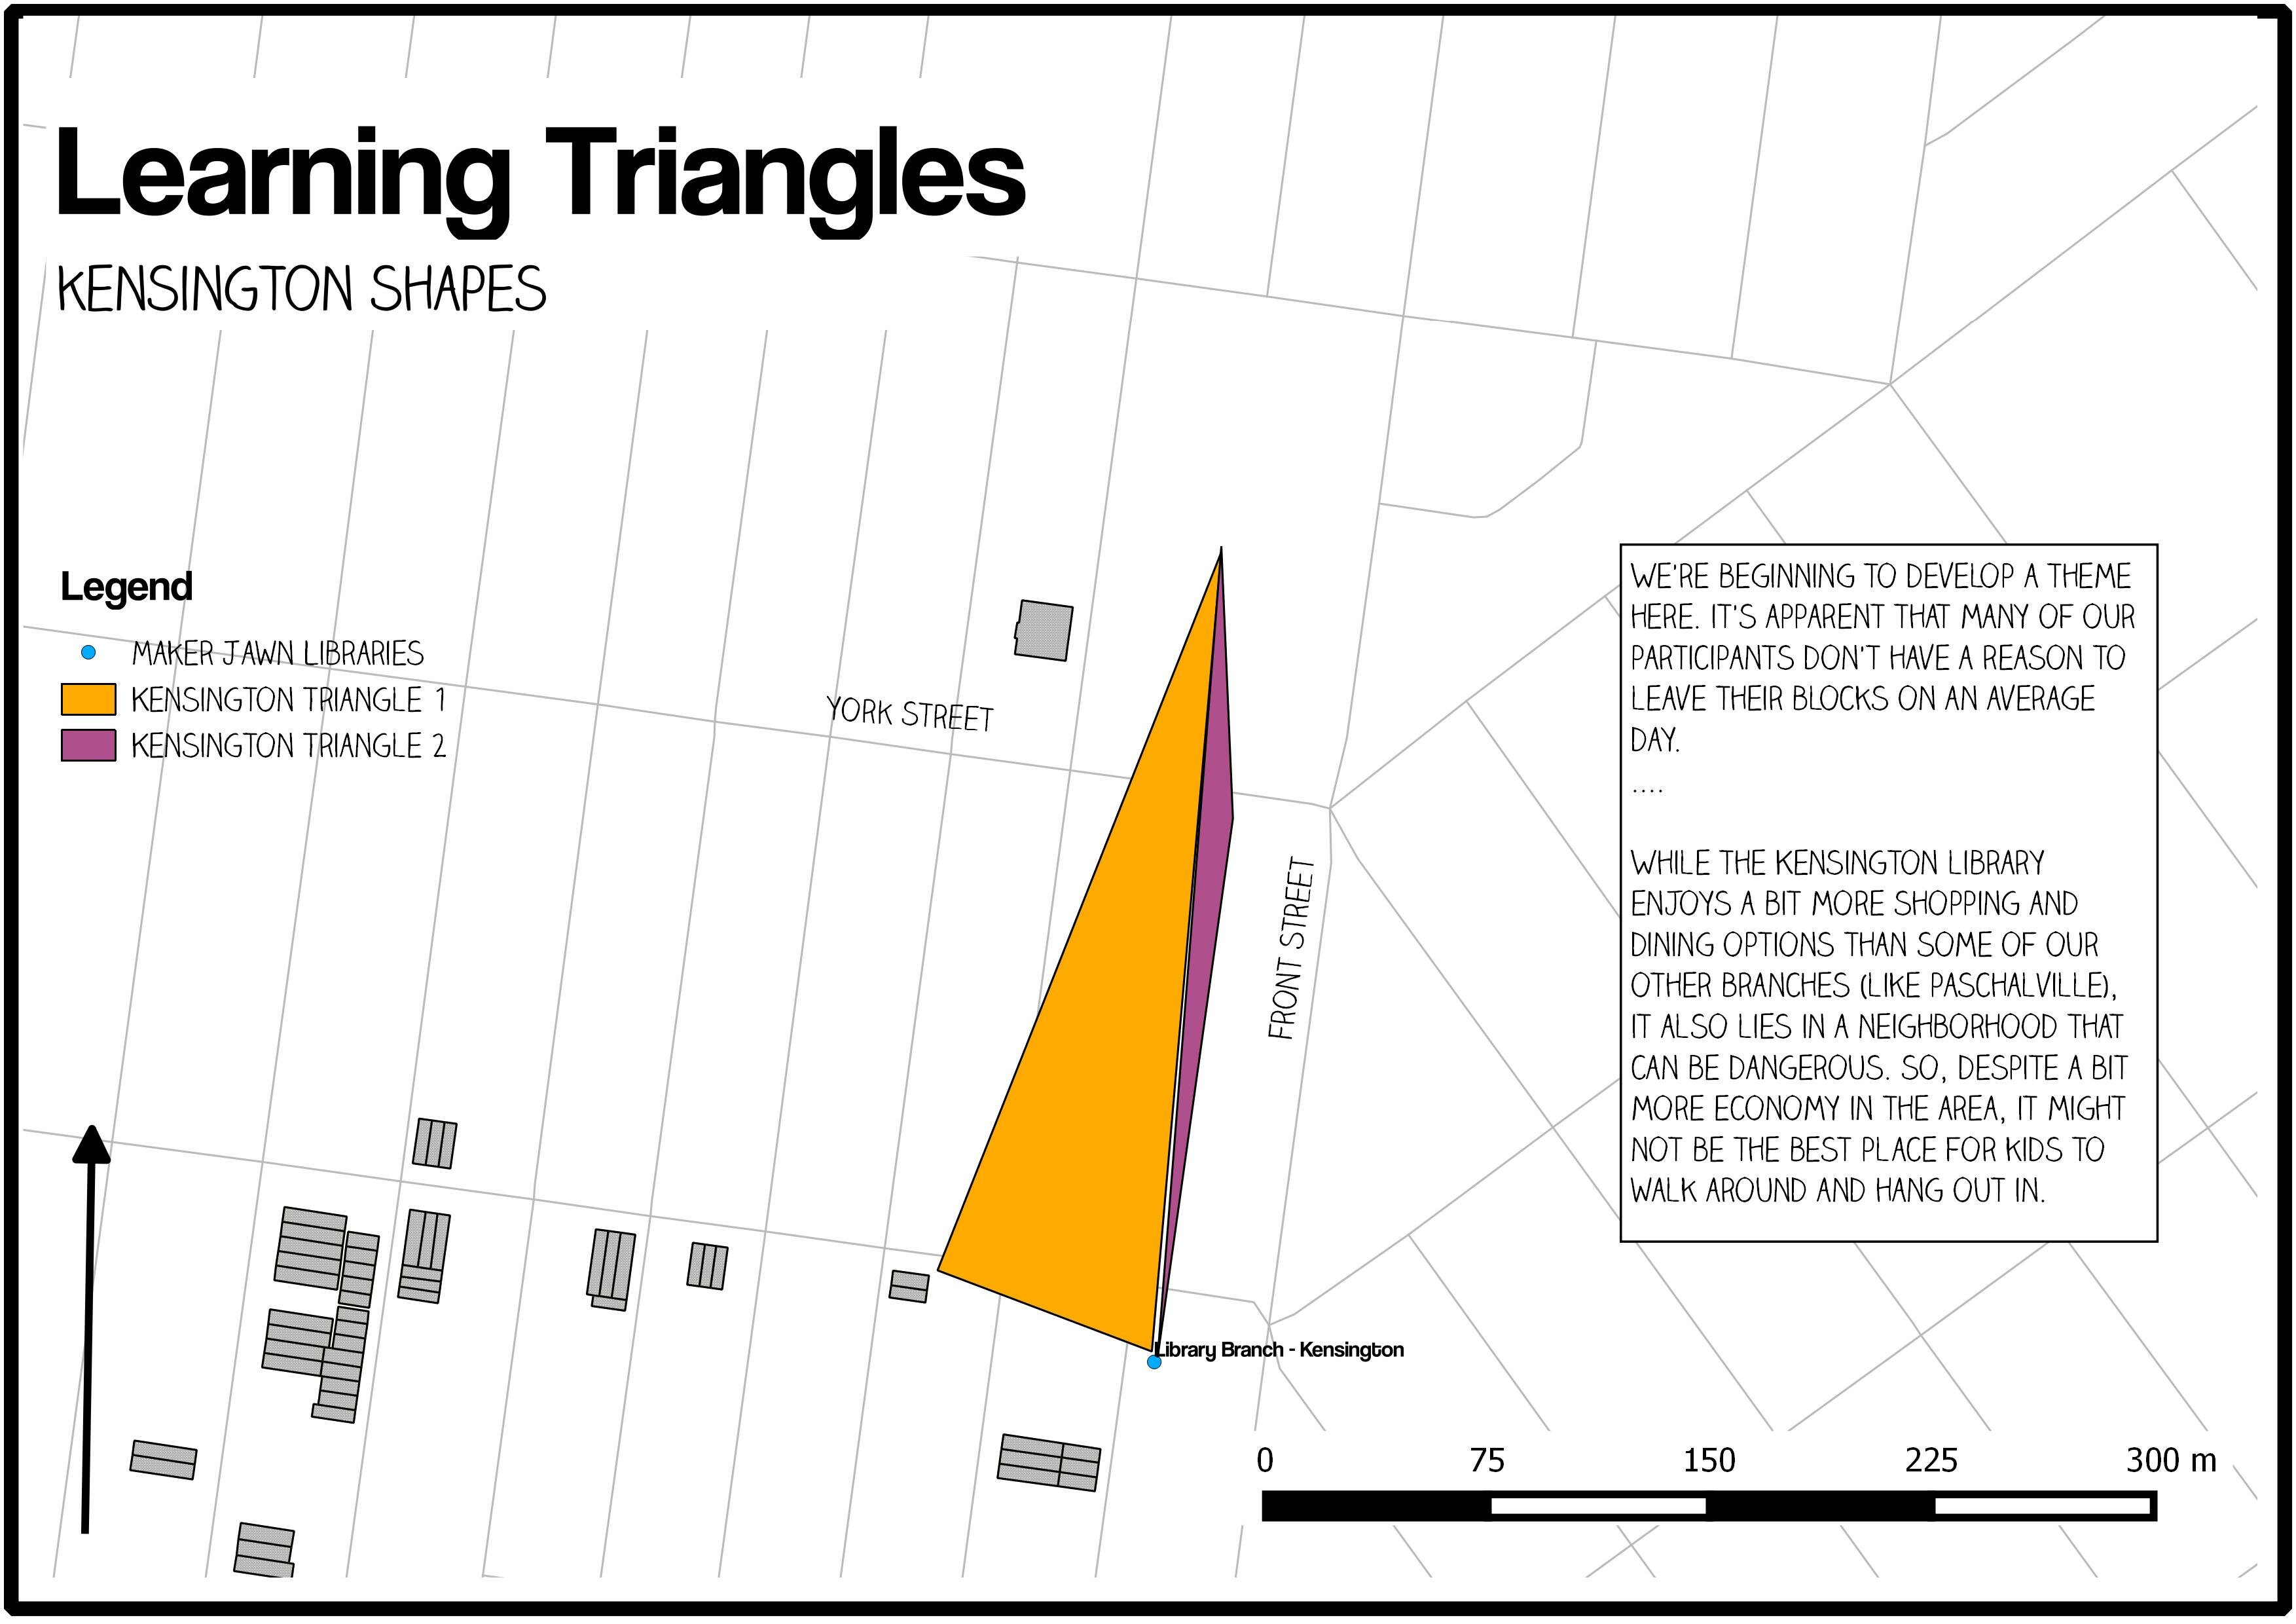
We can follow this trend to other locations as well. Look at some of our Widener participants’ triangles and our Kensington participants’ triangles!
However, not every participant has miniature Learning Triangles. Some are quite wild, actually:
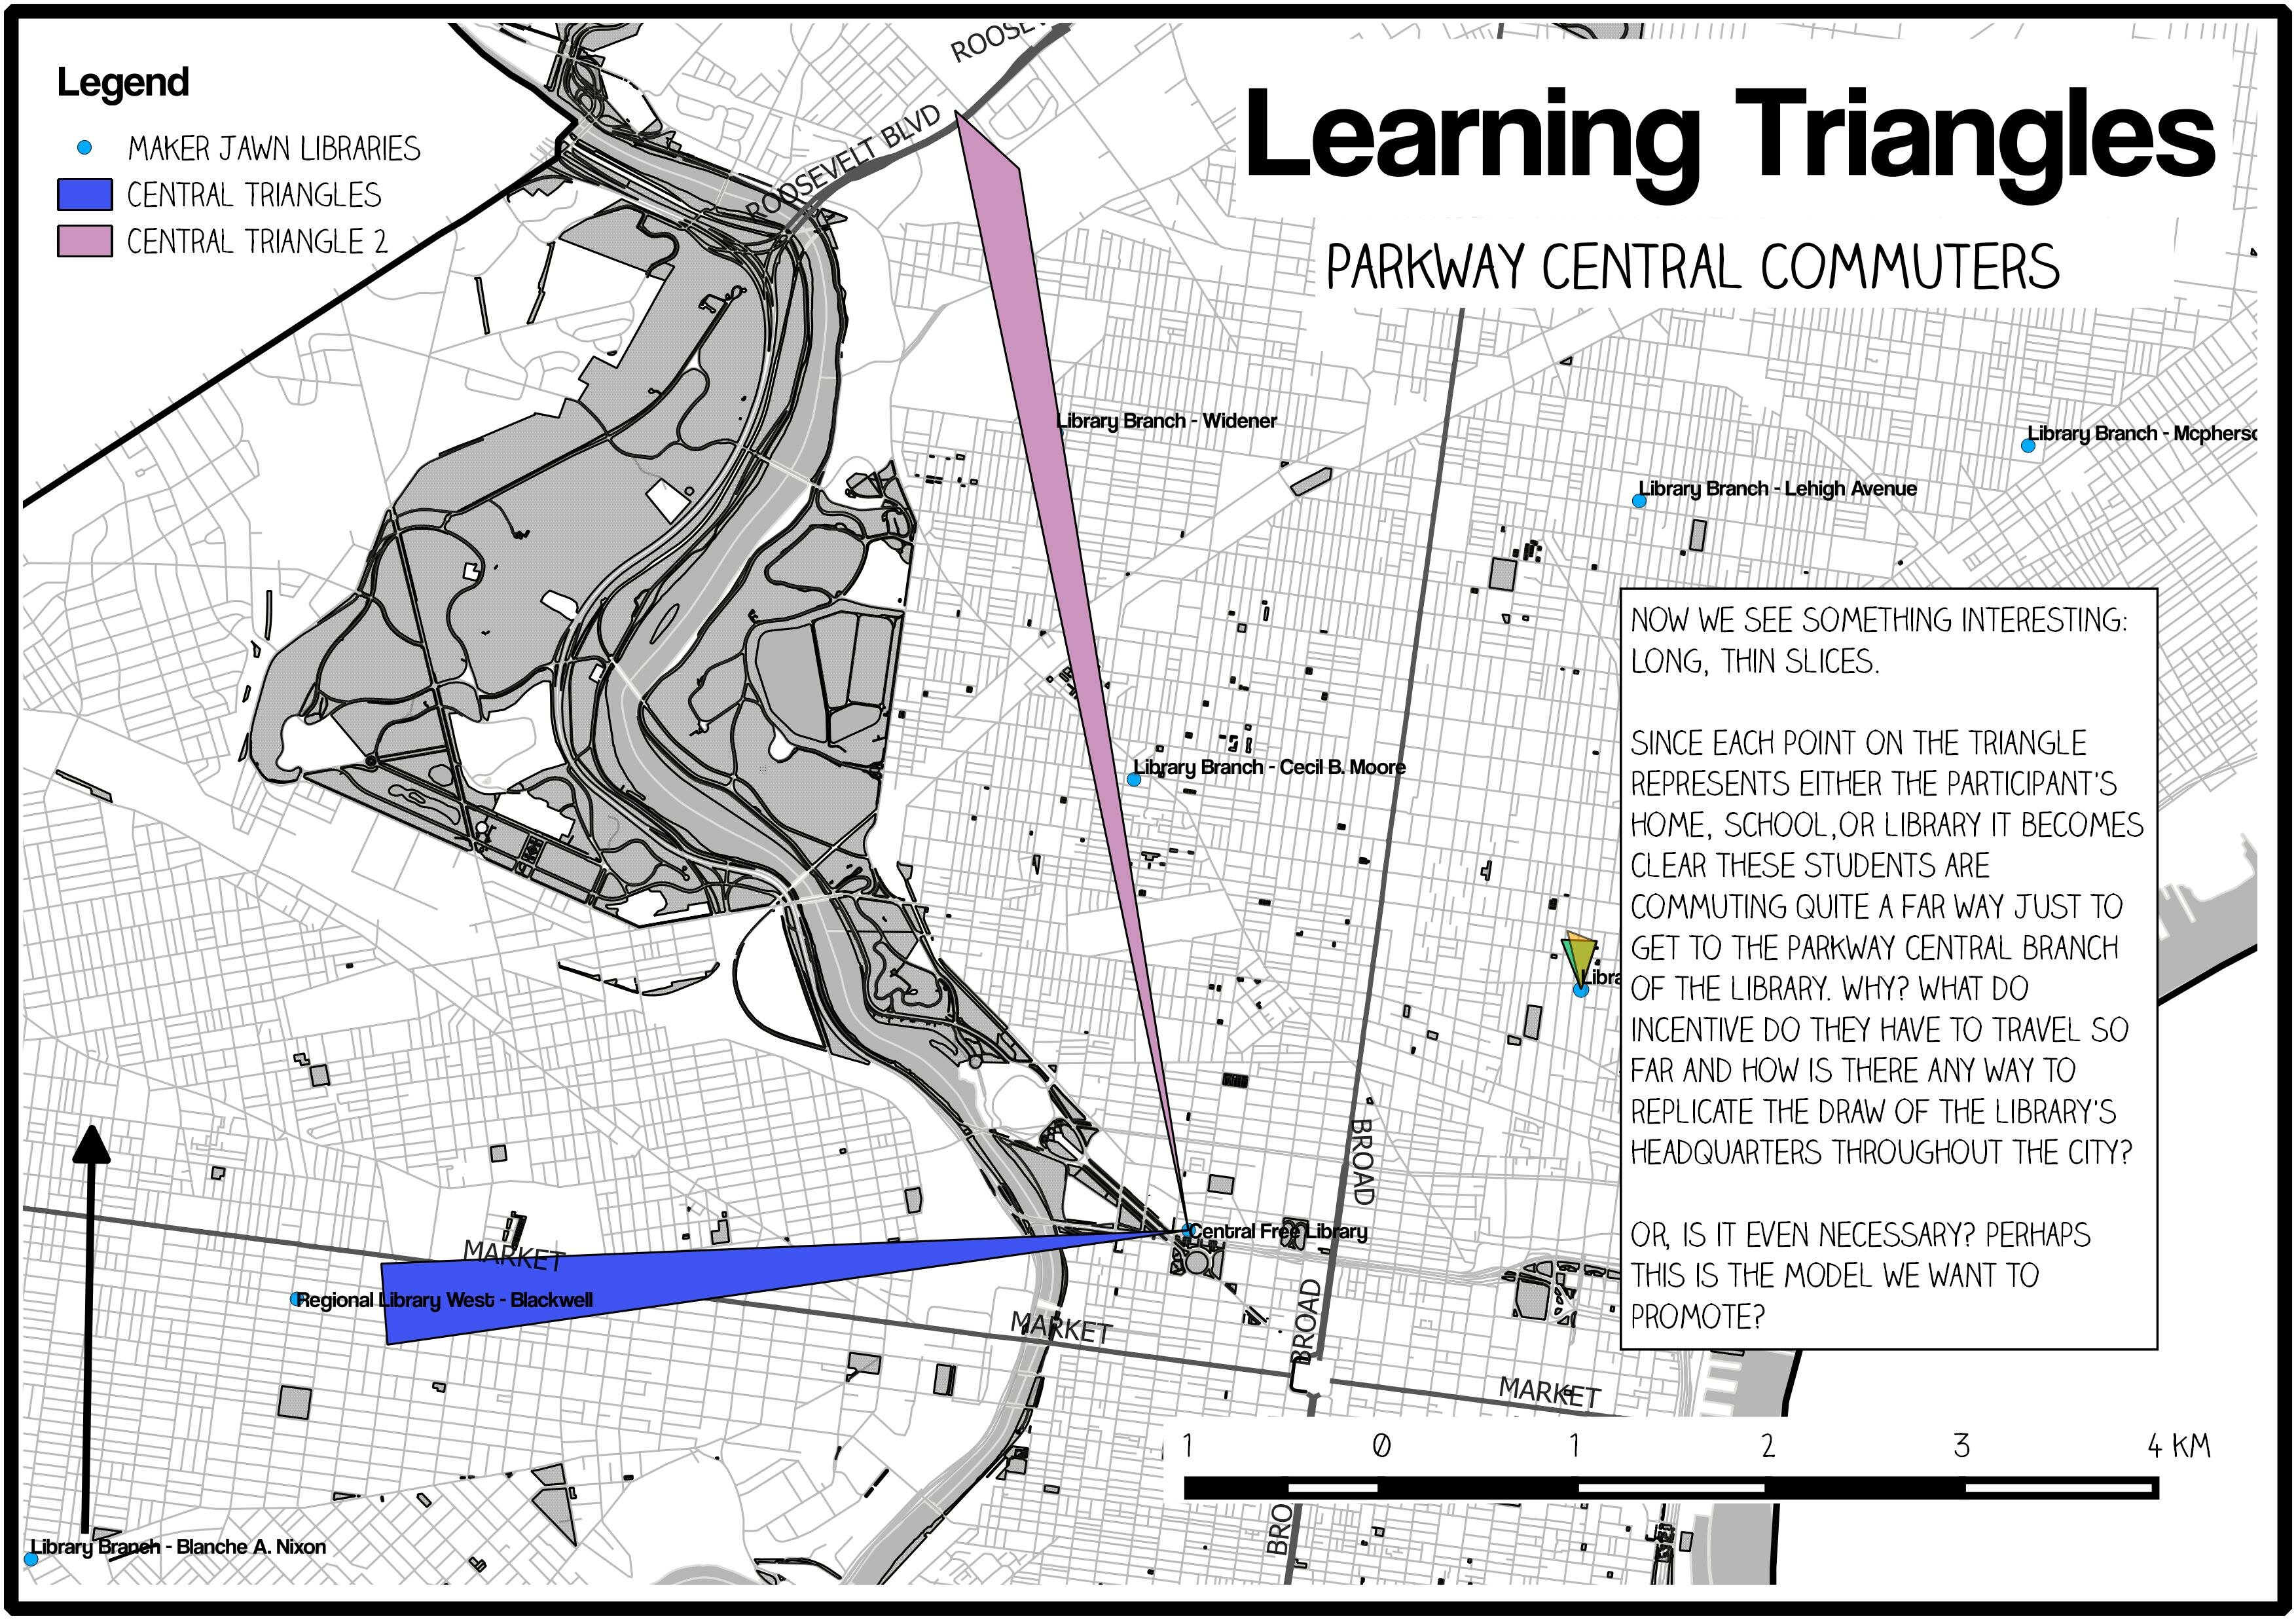
I wonder what this says about our program if kids are coming from different neighborhoods and bypassing multiple libraries just to attend a particular branch where we hold programming.
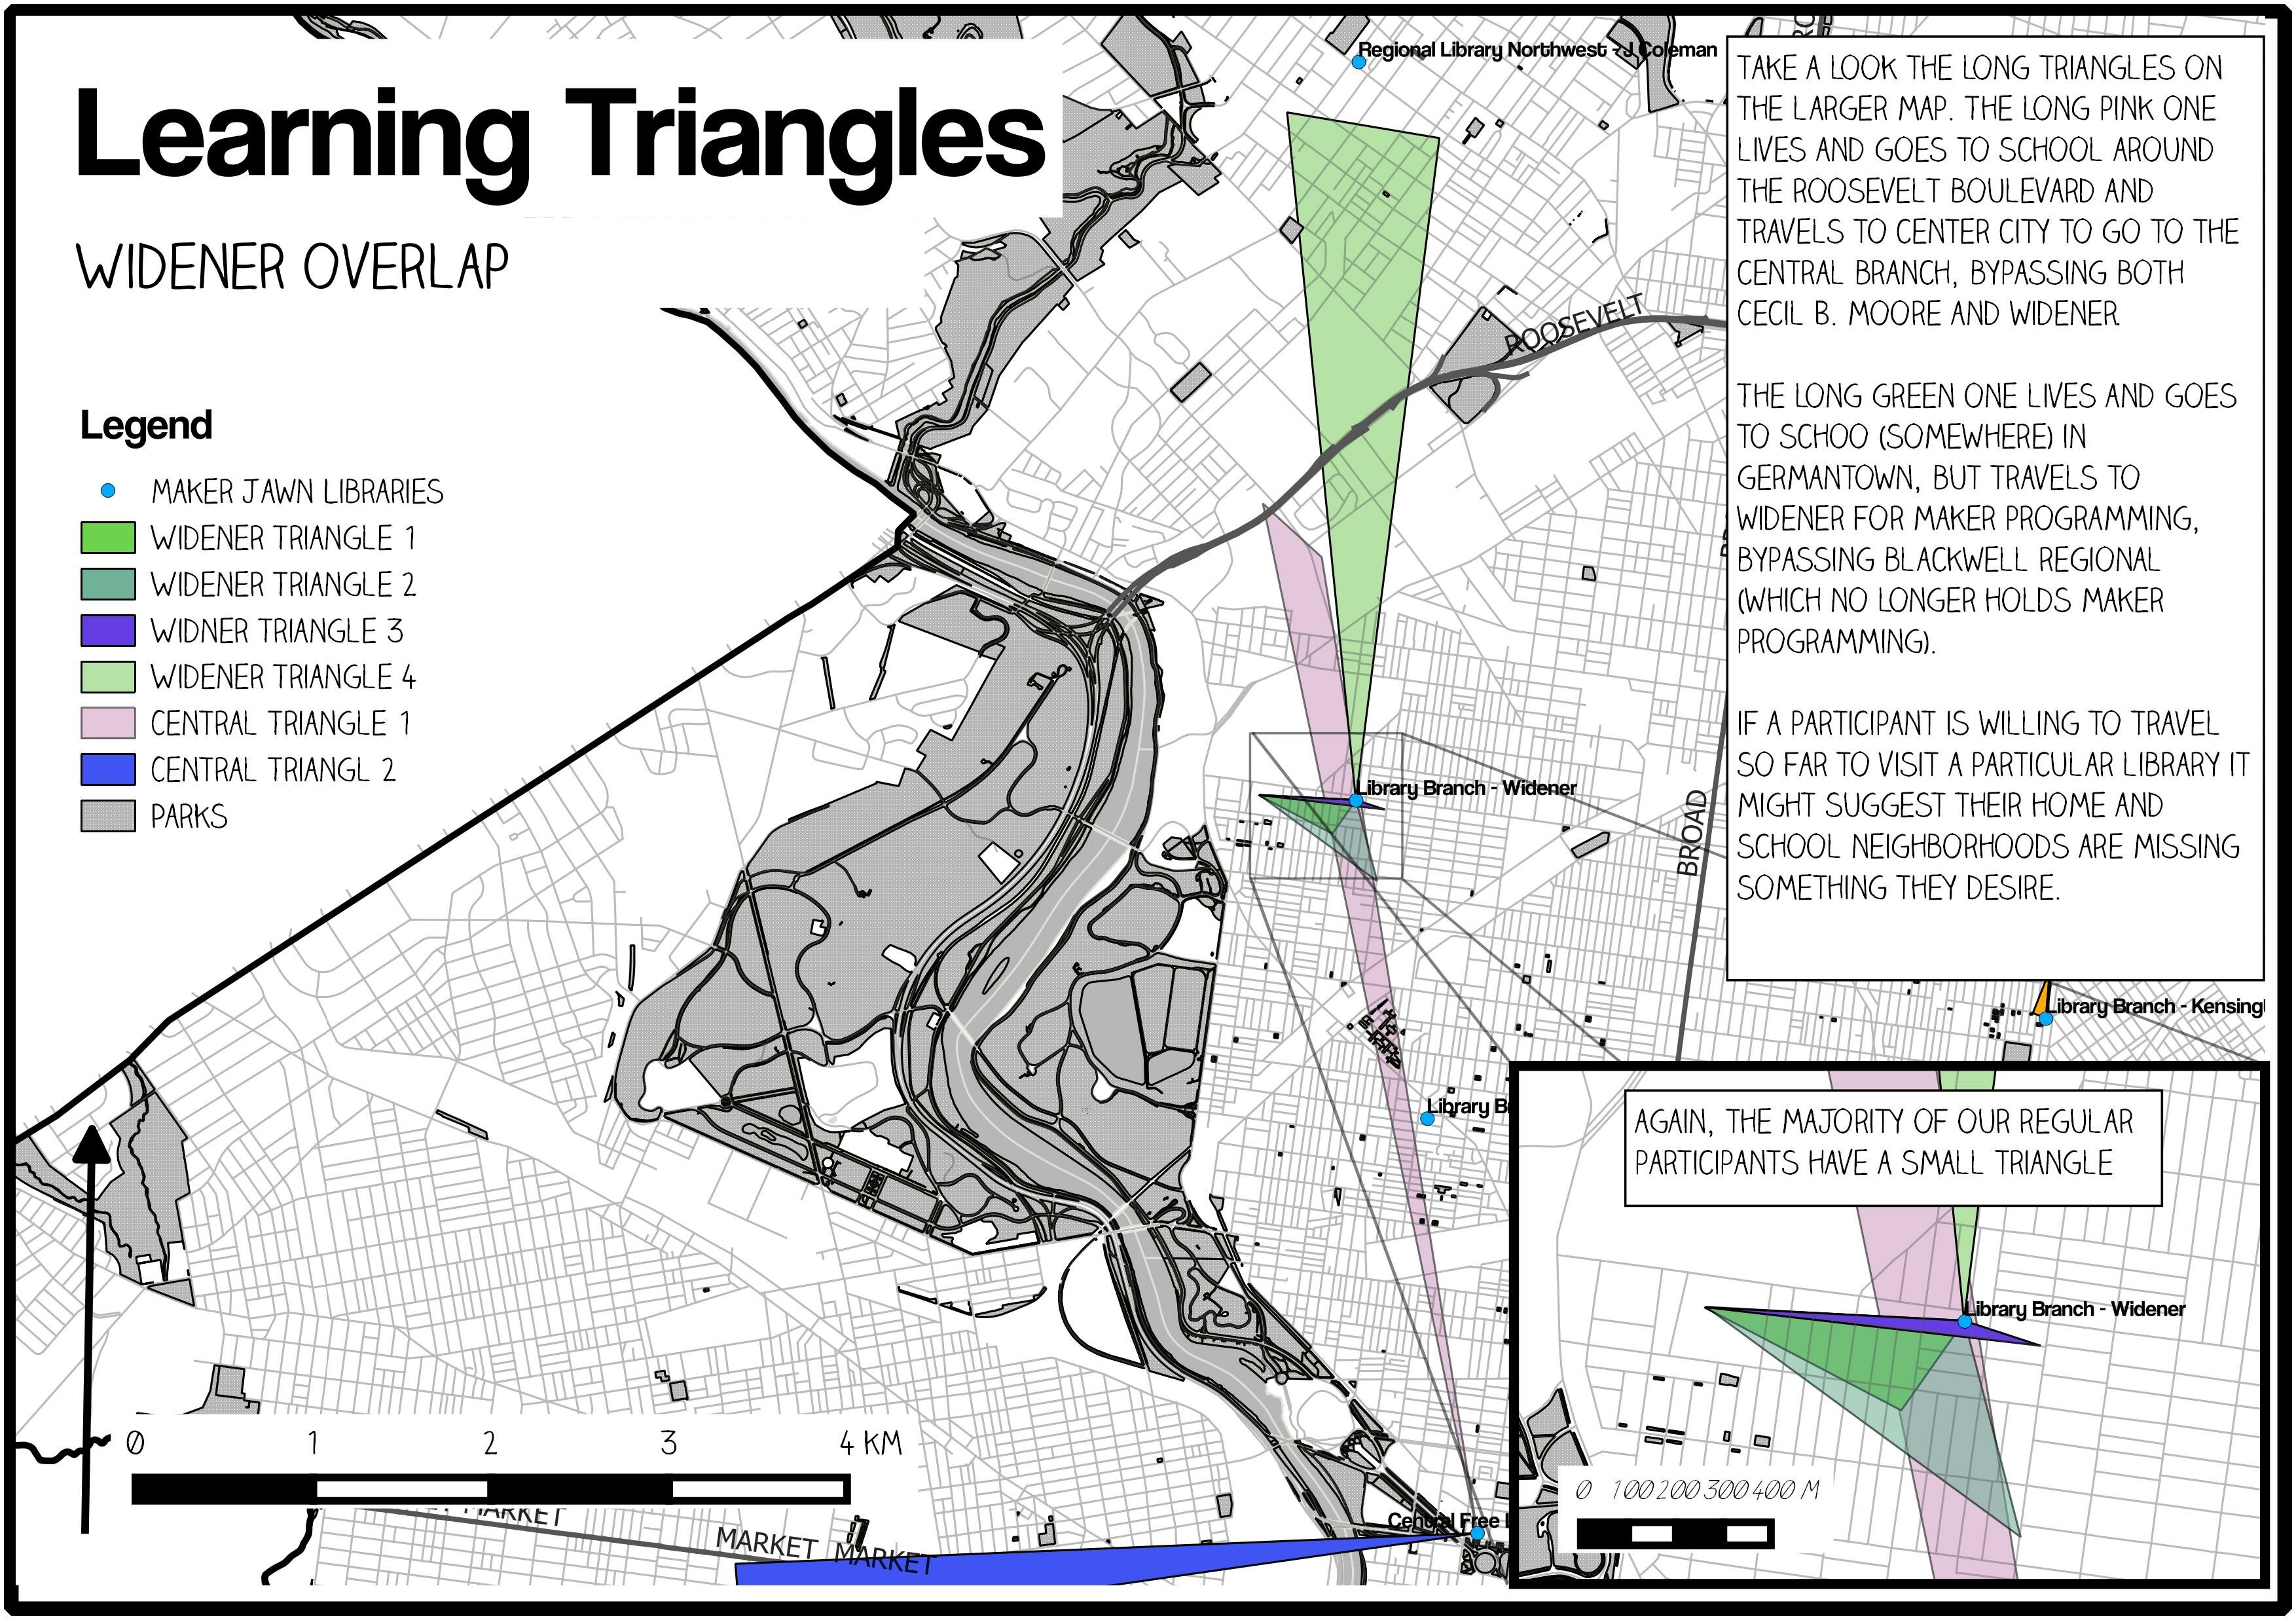
The next map is my favorite. It takes the previous map and adds another neighborhood library on to it and we can see serious overlap. My co-workers informed me the reason why participants travel so far to Widener and travel beyond nearby libraries is to hang out with Goda!
Again, this topic requires further research. If I had more time, I would conduct community assessments regarding cultural and educational resources in each area, I would interview our participants to see where they travel on any given day, and I would investigate what programs are held in the neighborhood. As it stands, though, this is a nice primer to help us think about how we can better serve our communities. What if the Free Library didn’t exist? What would take its place? What cultural and educational resources exist in your community?
Map Data available from Pennsylvania Spatial Data Access (www.pasda.psu.edu)
Map Design created with Quantum GIS (QGIS), an open source GIS program available at: http://www2.qgis.org/en/site/
Fonts
Title, Legend Title, and Library Branch Name: Coolvetica
Captions, Copy and Scale Bar: Claire Hand
Available at Dafont.com
Great post Gregg!